Thomas J. Garcia
The Richard Stockton
College of New Jersey
Final Climate Journal
Professor Tracey Baker

Climate Station Name:
PBO ANANTAPUR
Latitude: 14.583 Longitude: 77.633 Elevation: 364 ft
Number of years on
record: ~66 years
Standard Deviation:
MONTH
|
Precipitation (mm)
|
Minimum
Temperature (C°)
|
Maximum Temperature
(C°)
|
January
|
14.9
|
3.5
|
1.8
|
February
|
26.6
|
3.7
|
2.0
|
March
|
13.7
|
3.2
|
1.8
|
April
|
25.9
|
3.3
|
1.7
|
May
|
43.9
|
3.3
|
2.5
|
June
|
51.9
|
3.5
|
2.3
|
July
|
54.0
|
3.5
|
1.9
|
August
|
81.1
|
3.3
|
1.8
|
September
|
93.6
|
3.5
|
2.1
|
October
|
72.4
|
3.6
|
2.0
|
November
|
50.2
|
3.9
|
1.9
|
December
|
20.8
|
3.6
|
1.6
|
Climate characteristics:
Anthrome
characteristics: This station is a city in Adhra Pradesh, India located 221
miles south of the state’s capital. It is located in inland southeastern India.
The Anantapur district is part of the Red Corridor, which is a term used
to describe the eastern part of India that is impoverished and has a high rate
of illiteracy and population. The city has a population of 516,359. The
northern and central portions of this district are on a plateau and there are
six rivers that run through.
Koppen climate
classification: Anantapur’s classification is Aw. These climates have
monthly mean temperatures above 18°C in every month of the year. They
typically have a distinct dry season, with the driest month having
precipitation less than 60 mm. It is different than a tropical monsoon
climate because tropical savanna climate tends to either see less rainfall than
a tropical monsoon climate or have more distinct dry seasons than a tropical
monsoon climate.
Precipitation
|
Minimum Temperature
|
Maximum Temperature
|
||||||||||
MONTH
|
1911
|
1950
|
1992
|
2011
|
1962
|
1980
|
1989
|
2010
|
1962
|
1980
|
1989
|
2010
|
January
|
0.0
|
0.0
|
0.0
|
50.0
|
16.1
|
17.0
|
17.1
|
18.3
|
29.5
|
30.5
|
30.8
|
31.1
|
February
|
0.0
|
2.8
|
8.9
|
3.0
|
19.4
|
19.9
|
17.5
|
19.0
|
30.9
|
34.2
|
34.0
|
36.0
|
March
|
0.8
|
0.0
|
0.0
|
61.1
|
22.5
|
22.4
|
22.0
|
22.4
|
37.4
|
37.3
|
35.4
|
39.6
|
April
|
32.3
|
0.0
|
0.0
|
57.4
|
25.1
|
26.3
|
25.9
|
25.7
|
39.5
|
39.2
|
39.5
|
40.8
|
May
|
59.7
|
79.8
|
2.0
|
210.9
|
25.9
|
26.8
|
26.6
|
26.2
|
37.6
|
40.4
|
40.2
|
39.3
|
June
|
72.6
|
36.3
|
12.2
|
143.7
|
24.5
|
25.2
|
24.7
|
25.1
|
35.4
|
34.5
|
35.9
|
36.1
|
July
|
15.9
|
42.9
|
55.0
|
12.2
|
24.0
|
24.5
|
23.6
|
23.5
|
33.9
|
34.1
|
32.6
|
32.5
|
August
|
25.9
|
61.5
|
63.3
|
108.4
|
23.6
|
24.0
|
23.6
|
23.2
|
31.6
|
33.7
|
32.9
|
32.5
|
September
|
126.0
|
89.2
|
35.4
|
81.4
|
23.2
|
24.1
|
23.2
|
23.1
|
31.1
|
33.8
|
31.7
|
32.6
|
October
|
51.3
|
122.9
|
59.2
|
7.9
|
23.0
|
22.8
|
22.5
|
22.7
|
30.4
|
34.4
|
32.7
|
33.3
|
November
|
22.7
|
31.2
|
48.6
|
68.4
|
19.2
|
20.4
|
19.7
|
21.2
|
30.7
|
30.5
|
30.5
|
31.1
|
December
|
37.6
|
0.0
|
0.0
|
115.9
|
18.6
|
18.5
|
18.9
|
16.8
|
28.5
|
31.2
|
29.6
|
29.9
|
Climate
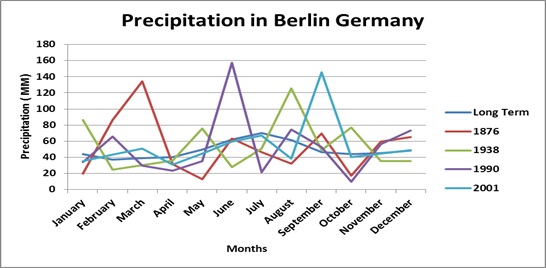
Station: Berlin/Dahlem
Latitude: 52.5 degrees
Longitude: 13.3 degrees
Elevation: 51m
Numbers of years on record: 125
Koppen Climate Classification:Cfb. Mild, humid climate. Coldest
month has a temperature under 18 degrees Celsius. Moist precipitation in all
months with no dry season and a warm summer season.
Standard Deviation:
MONTH
|
Precipitation
(mm)
|
Min. Temp
( C)
|
Max. Temp
( C )
|
January
|
26.97
|
5.3
|
4.7
|
February
|
26.44
|
5.0
|
4.7
|
March
|
26.83
|
3.9
|
4.9
|
April
|
30.81
|
3.5
|
4.9
|
May
|
40.19
|
3.7
|
5.0
|
June
|
48.71
|
3.2
|
4.6
|
July
|
53.78
|
2.8
|
4.2
|
August
|
55.12
|
2.8
|
4.0
|
September
|
37.50
|
3.1
|
4.0
|
October
|
31.62
|
3.7
|
4.2
|
November
|
32.17
|
3.8
|
4.0
|
December
|
28.45
|
4.5
|
4.3
|
Anthrome: Mostly urban, immediately surrounded with dense
settlements and rainfed mosaic villages. The area around Berlin is mostly
residential, rain-fed mosaic.
Climate Characteristics: Has a summer and winter season. All
seasons experience some amount of precipitation. June through August receive
the highest amount of precipitation. Winter is experienced in January and
February. Highest temperatures are experienced in July through August.
Precipitation (mm)
|
Minimum Temperature ( C )
|
Maximum Temperature ( C )
|
|||||||||||||
MONTH
|
Long Term
|
1876
|
1938
|
1990
|
2001
|
Long Term
|
1876
|
1938
|
1990
|
2001
|
Long Term
|
1876
|
1938
|
1990
|
2001
|
Jan
|
43.8
|
19.6
|
86.0
|
33.8
|
35.4
|
-2.8
|
-4.1
|
-0.8
|
1.6
|
-1.7
|
2
|
-0.1
|
4.1
|
5.8
|
2.9
|
Feb
|
37.2
|
86.1
|
24.7
|
65.6
|
43.3
|
-2.2
|
0.0
|
-1.0
|
2.8
|
-1.9
|
3.5
|
4.5
|
5
|
10.6
|
5
|
Mar
|
39.1
|
134.3
|
30.4
|
29.4
|
50.9
|
0.3
|
2.4
|
3.6
|
4.2
|
0.2
|
7.8
|
7.8
|
12.8
|
12
|
6.4
|
Apr
|
40.2
|
31.7
|
36.0
|
23.3
|
30.9
|
3.9
|
6.2
|
2.3
|
4.5
|
3.8
|
13.2
|
13.9
|
10.5
|
14.4
|
12.9
|
May
|
49.8
|
12.9
|
75.7
|
35.1
|
44.7
|
8.3
|
6.6
|
6.4
|
8.9
|
9.1
|
18.8
|
14.4
|
18
|
21
|
20.2
|
Jun
|
61.8
|
63.5
|
27.6
|
157.5
|
59.3
|
11.6
|
14.4
|
11.3
|
12.3
|
9.7
|
22
|
23
|
22.1
|
21
|
19.8
|
Jul
|
70.1
|
46.7
|
51.0
|
21.3
|
66.8
|
13.5
|
15.4
|
13.2
|
12.4
|
13.7
|
23.6
|
24.5
|
24.3
|
22.7
|
24.9
|
Aug
|
61.6
|
31.9
|
125.7
|
74.7
|
38.1
|
13.0
|
15.4
|
15.3
|
13.6
|
14.1
|
22.9
|
24.2
|
24.6
|
24.8
|
24.7
|
Sept
|
46.6
|
69.4
|
48.9
|
52.4
|
145.5
|
9.7
|
11.2
|
9.7
|
9.3
|
9.5
|
18.9
|
17.4
|
20
|
16.6
|
16
|
Oct
|
43.6
|
17.1
|
77.0
|
9.8
|
40.2
|
5.7
|
9.1
|
6.7
|
6.7
|
8.8
|
13
|
15
|
12.9
|
15.3
|
16.6
|
Nov
|
45.2
|
59.4
|
35.2
|
56.6
|
44.3
|
1.7
|
0.1
|
5.3
|
3.2
|
0.8
|
6.7
|
3.8
|
10.6
|
7.4
|
6.5
|
Dec
|
48.4
|
65.0
|
35.3
|
73
|
48.9
|
-1.2
|
-1.0
|
-3.6
|
-1.1
|
-2.4
|
3.1
|
3.1
|
0.6
|
2.8
|
1.7
|
Charts:


Climate
station name: BURDEKIN SHIRE COUNCIL, ASN00033001
Latitude:-19.5775 Longitude:147.4075 Elevation: 10.7
Number of
years on record: 1887-2010; 123 years
Standard
deviation:
Month
|
PRCP
|
TMIN
|
TMAX
|
January
|
218.8
|
2.1
|
2.5
|
February
|
209.6
|
2.5
|
2.3
|
March
|
148.0
|
2.5
|
1.9
|
April
|
84.6
|
2.7
|
1.9
|
May
|
47.6
|
3.5
|
1.8
|
June
|
41.6
|
3.9
|
2.2
|
July
|
37.3
|
4.0
|
2.1
|
August
|
21.0
|
3.4
|
2.1
|
September
|
47.3
|
3.0
|
2.2
|
October
|
34.0
|
2.7
|
2.2
|
November
|
54.7
|
2.3
|
2.0
|
December
|
103.5
|
2.3
|
2.2
|
Climate
characteristics: Burdekin Shire Council lies in a humid subtropical zonewhere the
summers are humid and wet and the winters are dry.
Anthrome
characteristics: residential irrigated cropland surrounded by populated rangelands
and residential rainforest mosaics
Köppen
climate classification: humid tropical to subtropical
climatewith typically warm and humid summers and dry winters. Has the highest amount of precipitation with
frequent thunderstorms in the summer and is prone to cyclonic storm activity in
the winter.
Precipitation:

Temperature Minimum:

Temperature Maximun:

Climate Station Name:
Orlinga, Russia
Latitude: 56.05˚
North Longitude: 105.833˚ East Elevation: 338 feet
Number of years on
record: 57 years. The precipitation recordings began in 1932, but in order
to make a more cohesive comparison of temperatures and precipitations, we chose
to analyze the values beginning in 1954 when adequate temperature data began.
Climate
characteristics: Orlinga has a seasonal climate, with the summer months of
May-August being the warmest. The summer temperatures are very mild, averaging
around 62˚F
in July. The winter months, between November and February usually stay below
freezing. Despite the cold weather, it is an arid climate with very low
precipitation averages with only about 13 inches of total precipitation a year.
Anthrome
characteristics: Orlinga, Russia is located in a wild and remotely forested
area of south-eastern Siberia within the Irkutsk Oblast province. There are
also a few areas of populated forest. The topography consists mainly of hills
and valleys within the Central Siberian Plateau. The region in which Orlinga is
located is very sparsely populated, with an average of 3.5 people per square
kilometer in the rural regions.
Koppen climate
classification: Cool continental climate/subarctic climate (Dwc).
MONTH
|
AVERAGE
|
STDEV
|
MIN
|
MAX
|
1954
|
1982
|
1990
|
2010
|
January
|
-33.3
|
9.3
|
-42.6
|
-24.0
|
-29.9
|
-39.2
|
-38.1
|
-37.0
|
February
|
-31.5
|
9.0
|
-40.6
|
-22.5
|
-35.1
|
-30.3
|
-24.8
|
-36.9
|
March
|
-23.6
|
8.5
|
-32.1
|
-15.1
|
-28.8
|
-25.4
|
-15.1
|
-26.7
|
April
|
-10.0
|
6.6
|
-16.6
|
-3.4
|
-11.7
|
-5.9
|
-8.9
|
-16.1
|
May
|
-16.4
|
3.4
|
-19.8
|
-13.0
|
-2.2
|
-1.7
|
0.4
|
-0.3
|
June
|
5.7
|
4.1
|
1.6
|
9.7
|
6.6
|
7.2
|
4.1
|
5.7
|
July
|
9.6
|
3.6
|
6.1
|
13.2
|
10.0
|
9.8
|
9.2
|
11.0
|
August
|
7.3
|
3.6
|
3.7
|
11.0
|
7.4
|
7.5
|
9.1
|
6.3
|
September
|
0.9
|
4.2
|
-3.3
|
5.1
|
0.9
|
-0.1
|
-1.3
|
-0.5
|
October
|
-7.5
|
6.2
|
-13.6
|
-1.3
|
-5.8
|
-7.5
|
-4.9
|
-6.1
|
November
|
-19.9
|
9.3
|
-29.2
|
-10.6
|
-18.6
|
-15.7
|
-17.7
|
-17.0
|
December
|
-29.1
|
9.6
|
-38.7
|
-19.5
|
-28.9
|
-21.9
|
-25.5
|
-35.6
|

Average Maximum Temperatures
Month
|
Average
|
STDEV
|
Min Range
|
Max Range
|
1954
|
1982
|
1990
|
2010
|
January
|
-21.5
|
8.8
|
-30.3
|
-12.6
|
-24.9
|
-26.1
|
-24.5
|
-29.7
|
February
|
-14.6
|
7.9
|
-22.5
|
-6.7
|
-15.8
|
-12.3
|
-10.8
|
-19.8
|
March
|
-2.9
|
6.7
|
-9.7
|
3.8
|
-5.1
|
-4.1
|
5.0
|
-5.3
|
April
|
5.9
|
5.4
|
0.5
|
11.3
|
3.5
|
8.7
|
5.9
|
4.8
|
May
|
14.6
|
6.1
|
8.5
|
20.7
|
12.2
|
14.2
|
19.3
|
14.3
|
June
|
22.5
|
5.8
|
16.7
|
28.3
|
24.4
|
21.2
|
22.0
|
23.6
|
July
|
25.3
|
4.7
|
20.5
|
30.0
|
24.2
|
22.8
|
26.9
|
25.5
|
August
|
21.6
|
5.0
|
16.6
|
26.6
|
24.7
|
20.5
|
23.4
|
19.3
|
September
|
13.6
|
5.6
|
8.0
|
19.2
|
11.7
|
11.8
|
14.2
|
13.1
|
October
|
2.9
|
5.8
|
-2.8
|
8.7
|
2.9
|
0.7
|
8.6
|
2.9
|
November
|
-9.4
|
8.2
|
-17.5
|
-1.2
|
-11.1
|
-5.8
|
-7.3
|
-6.4
|
December
|
-18.8
|
9.4
|
-28.2
|
-9.4
|
-20.1
|
-12.2
|
-16.3
|
-26.6
|

Average Precipitation
MONTH
|
PRCP
|
STDEV
|
Min Range
|
Max Range
|
1954
|
1982
|
1990
|
2010
|
January
|
15.1
|
8.4
|
6.8
|
23.5
|
20.1
|
14.3
|
15.2
|
22.1
|
February
|
10.7
|
4.7
|
6.0
|
15.4
|
8.1
|
9.2
|
19.8
|
7.0
|
March
|
9.7
|
6.4
|
3.3
|
16.1
|
10.0
|
12.7
|
4.6
|
13.1
|
April
|
13.6
|
7.5
|
6.1
|
21.0
|
9.1
|
18.1
|
17.7
|
10.1
|
May
|
27.4
|
13.3
|
14.1
|
40.8
|
19.6
|
43.2
|
12.1
|
41.8
|
June
|
52.0
|
30.6
|
21.3
|
82.6
|
24.7
|
56.1
|
63.7
|
38.3
|
July
|
74.4
|
39.9
|
34.5
|
114.2
|
153.2
|
94.5
|
45.2
|
108.5
|
August
|
70.0
|
30.0
|
40.0
|
100.0
|
43.1
|
56.4
|
48.4
|
24.4
|
September
|
38.6
|
15.4
|
23.3
|
54.0
|
51.0
|
45.1
|
33.9
|
40.3
|
October
|
25.0
|
12.4
|
12.6
|
37.4
|
18.8
|
36.4
|
25.9
|
67.9
|
November
|
24.1
|
14.6
|
9.5
|
38.6
|
21.9
|
29.5
|
20.1
|
23.3
|
December
|
21.2
|
8.4
|
12.8
|
29.6
|
19.3
|
32.1
|
20.5
|
21.6
|

Climate station name: Cherry Point MCAS
Latitude:
34.9 Longitude: -76.8833˚ Elevation: 11
Number of years on record:
66
Standard deviation:
Months
|
Precipitation (mm)
|
Minimum Temp (C˚)
|
Maximum Temp. (C˚)
|
1
|
52.6
|
56.4
|
63.1
|
2
|
47.5
|
53.3
|
59.8
|
3
|
255.5
|
51.5
|
55.3
|
4
|
42.5
|
46.5
|
46.1
|
5
|
64.0
|
38.9
|
37.8
|
6
|
61.1
|
29.7
|
32.0
|
7
|
97.0
|
22.8
|
26.1
|
8
|
119.9
|
21.2
|
25.8
|
9
|
101.4
|
31.9
|
32.3
|
10
|
63.8
|
49.8
|
39.7
|
11
|
55.9
|
53.5
|
50.6
|
12
|
49.0
|
56.1
|
64.7
|
Climate
Characteristics: Fairly high in
precipitation with changing seasons.
Koppen Climate
Classification: (CFA) This region
is a mild and humid climate that has moist, adequate precipitation in all
months, no dry seasons. It is also
classified as being a tropical, rainy climate with an average temperature of
every month is above 18 ᵒC


Climate Conclusions
Many conclusions
may be made from the collection and interpretation of data from all of climate
stations. There are many factors that
contribute to climate characteristic distribution throughout the world. It is easier for one to arrive at a
conclusions based on climate distribution by visually representing the data in
graphs and tables. By observing some of
the graphs and tables I made I came to the conclusion that many factors effect
climate distribution. Longitude and
latitude play a significant role in climate distribution. If a region is far from the equator, it will
most likely result in lower average annual temperatures in comparison to a
region closer to the equator. Equatorial
regions generally portray tropical rainy climates. Places of higher elevation experience little
change in temperature and remain more at a constant level annually, whereas
places of lower altitudes experience greater fluctuations of annual
temperature. It is evident that areas
with high human populations, such as within cities, can affect the average
maximum temperatures.
Human activity,
especially construction, affects the lands ability to absorb heat and
precipitation. With increased impervious
surfaces, a heat island affect is created; areas with highly dense urban
populations are usually found to be considerably hotter than areas with more
vegetative cover. Impervious surfaces
also affect the transpiration rate and can affect precipitation. Decreasing the amount of vegetation leads to
increased surface runoff, the water that should be absorbed by the plants and
soil travels with gravity and usually finds its way to a water treatment
facility. This has the potential to
decrease the annual precipitation of a region because surface runoff waters are
not being returned to the system. A
combination of factors affect the climate of a region; longitude, latitude, elevation,
distance from oceans, and human impacts.
No comments:
Post a Comment